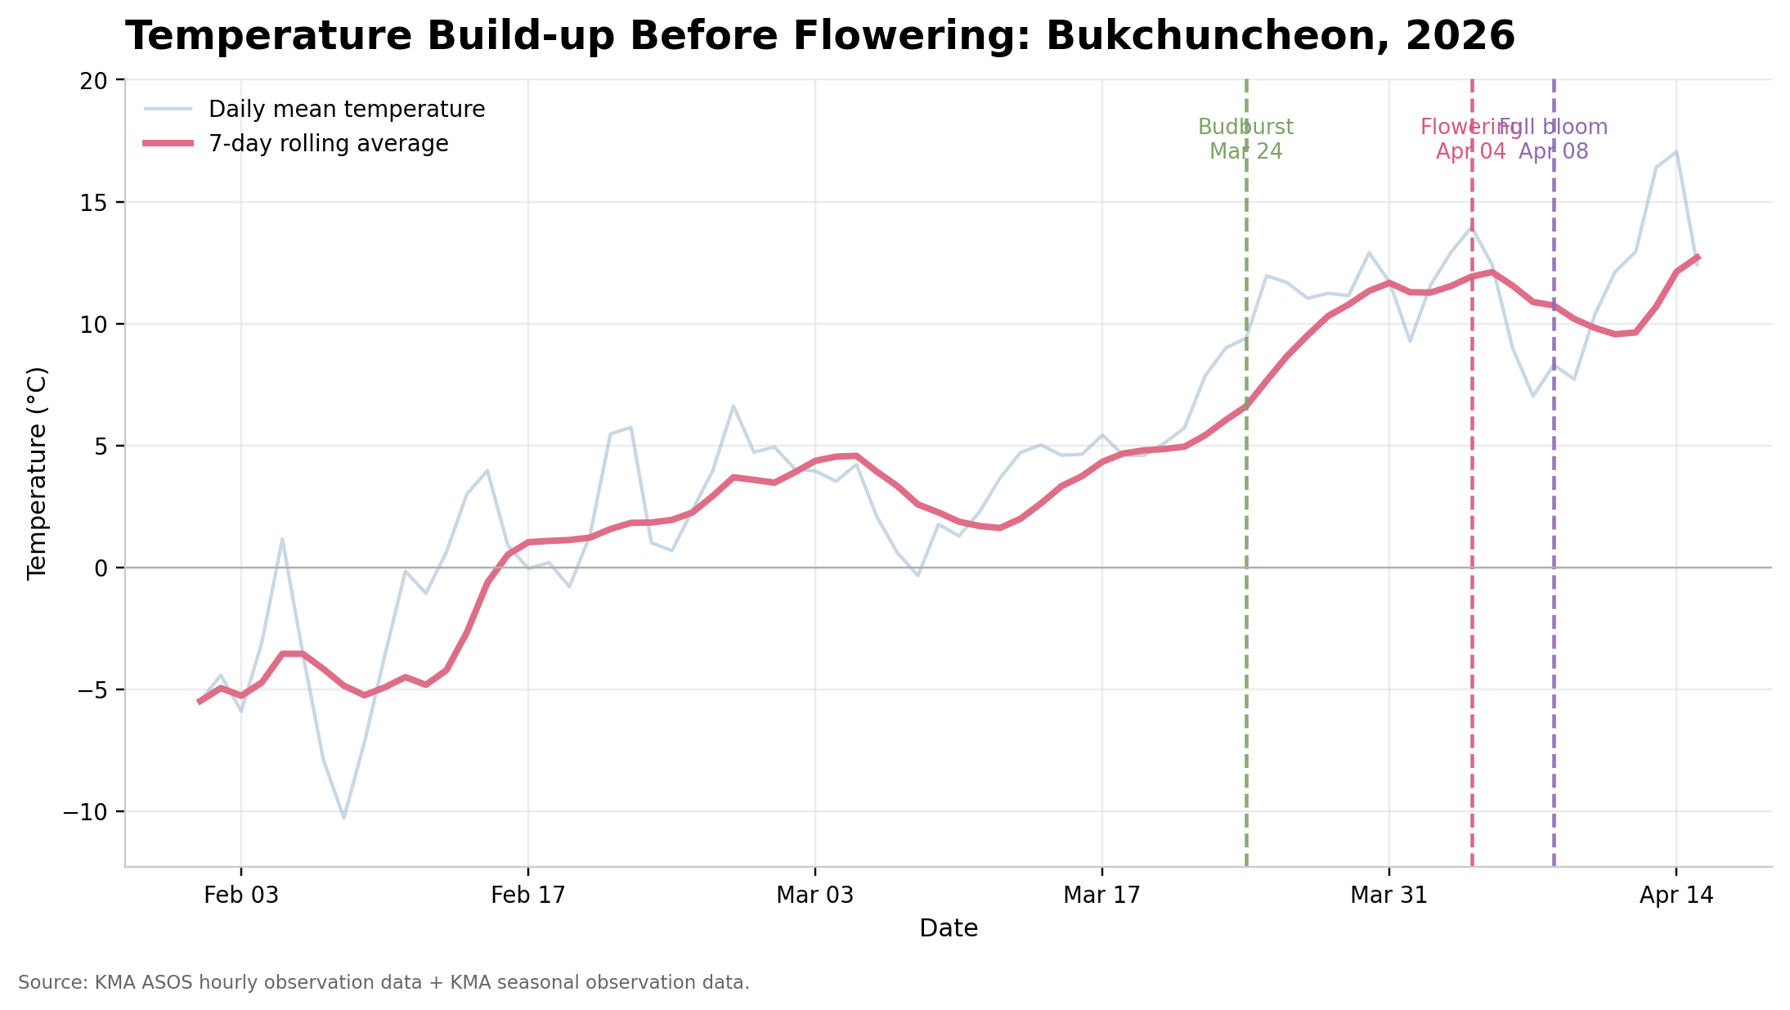
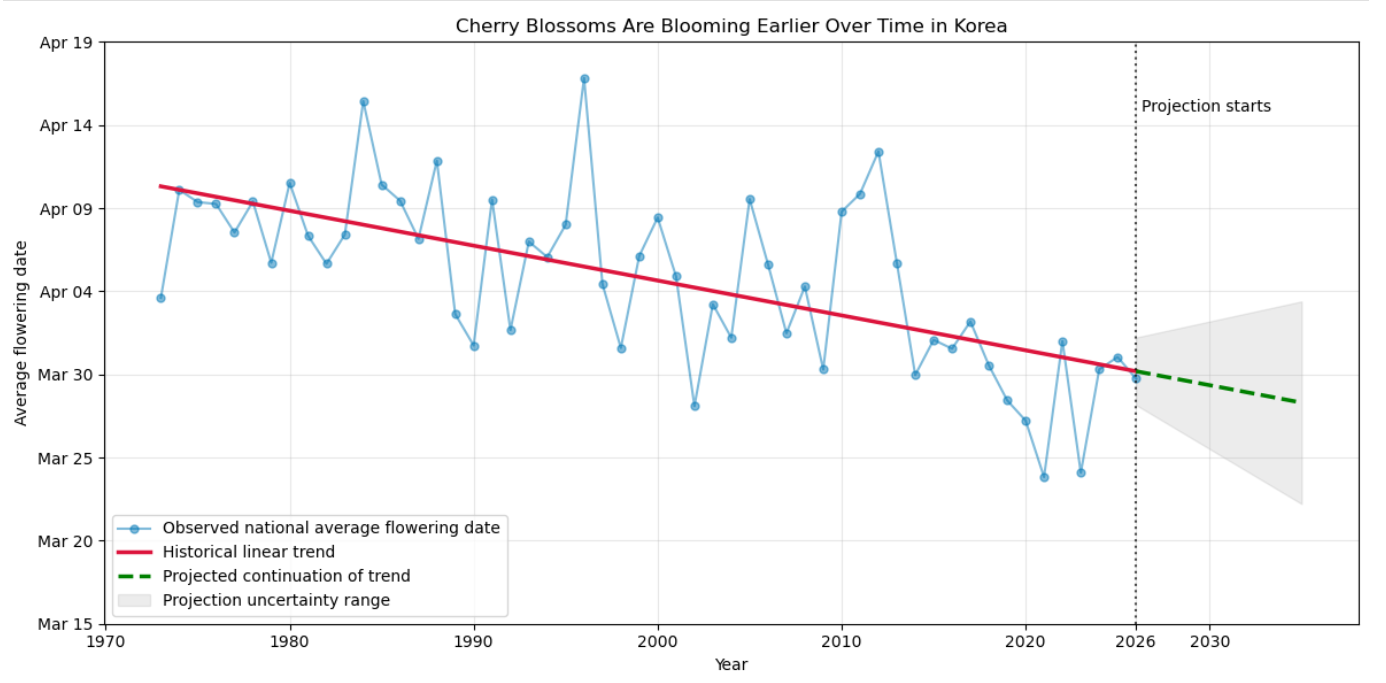
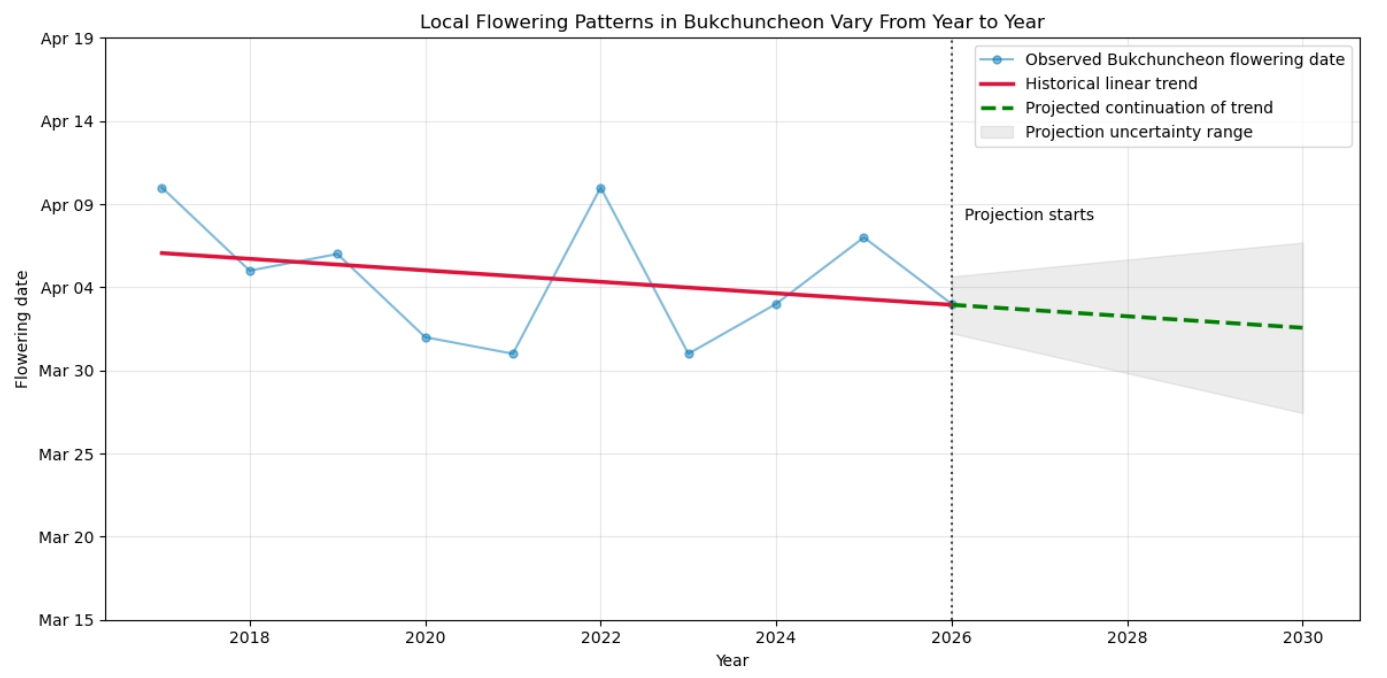
Through these visualizations, our project explored how cherry blossom flowering patterns vary across regions, respond to temperature conditions, and change over time in Korea. The results showed that flowering dates exhibited clear regional differences in 2026, that blossoms appeared earlier than their historical averages in many regions, and that a sustained accumulation of warmer temperatures before flowering appears to influence the exact timing of the bloom. In addition, long-term trend visualizations suggested that flowering dates in Korea have consistently trended earlier over time, while specific locations such as Bukchuncheon continue to show noticeable year-to-year variability.
Ultimately, these findings highlight that cherry blossoms are more than just a seasonal event. They can also serve as a powerful visual indicator of regional climate variations, the timing of spring, and long-term environmental changes in Korea. Future iterations of this project could be expanded by including additional climate variables, broader regional comparisons, and interactive web-based visualizations.
1. Regional Differences in Cherry Blossom Flowering Dates
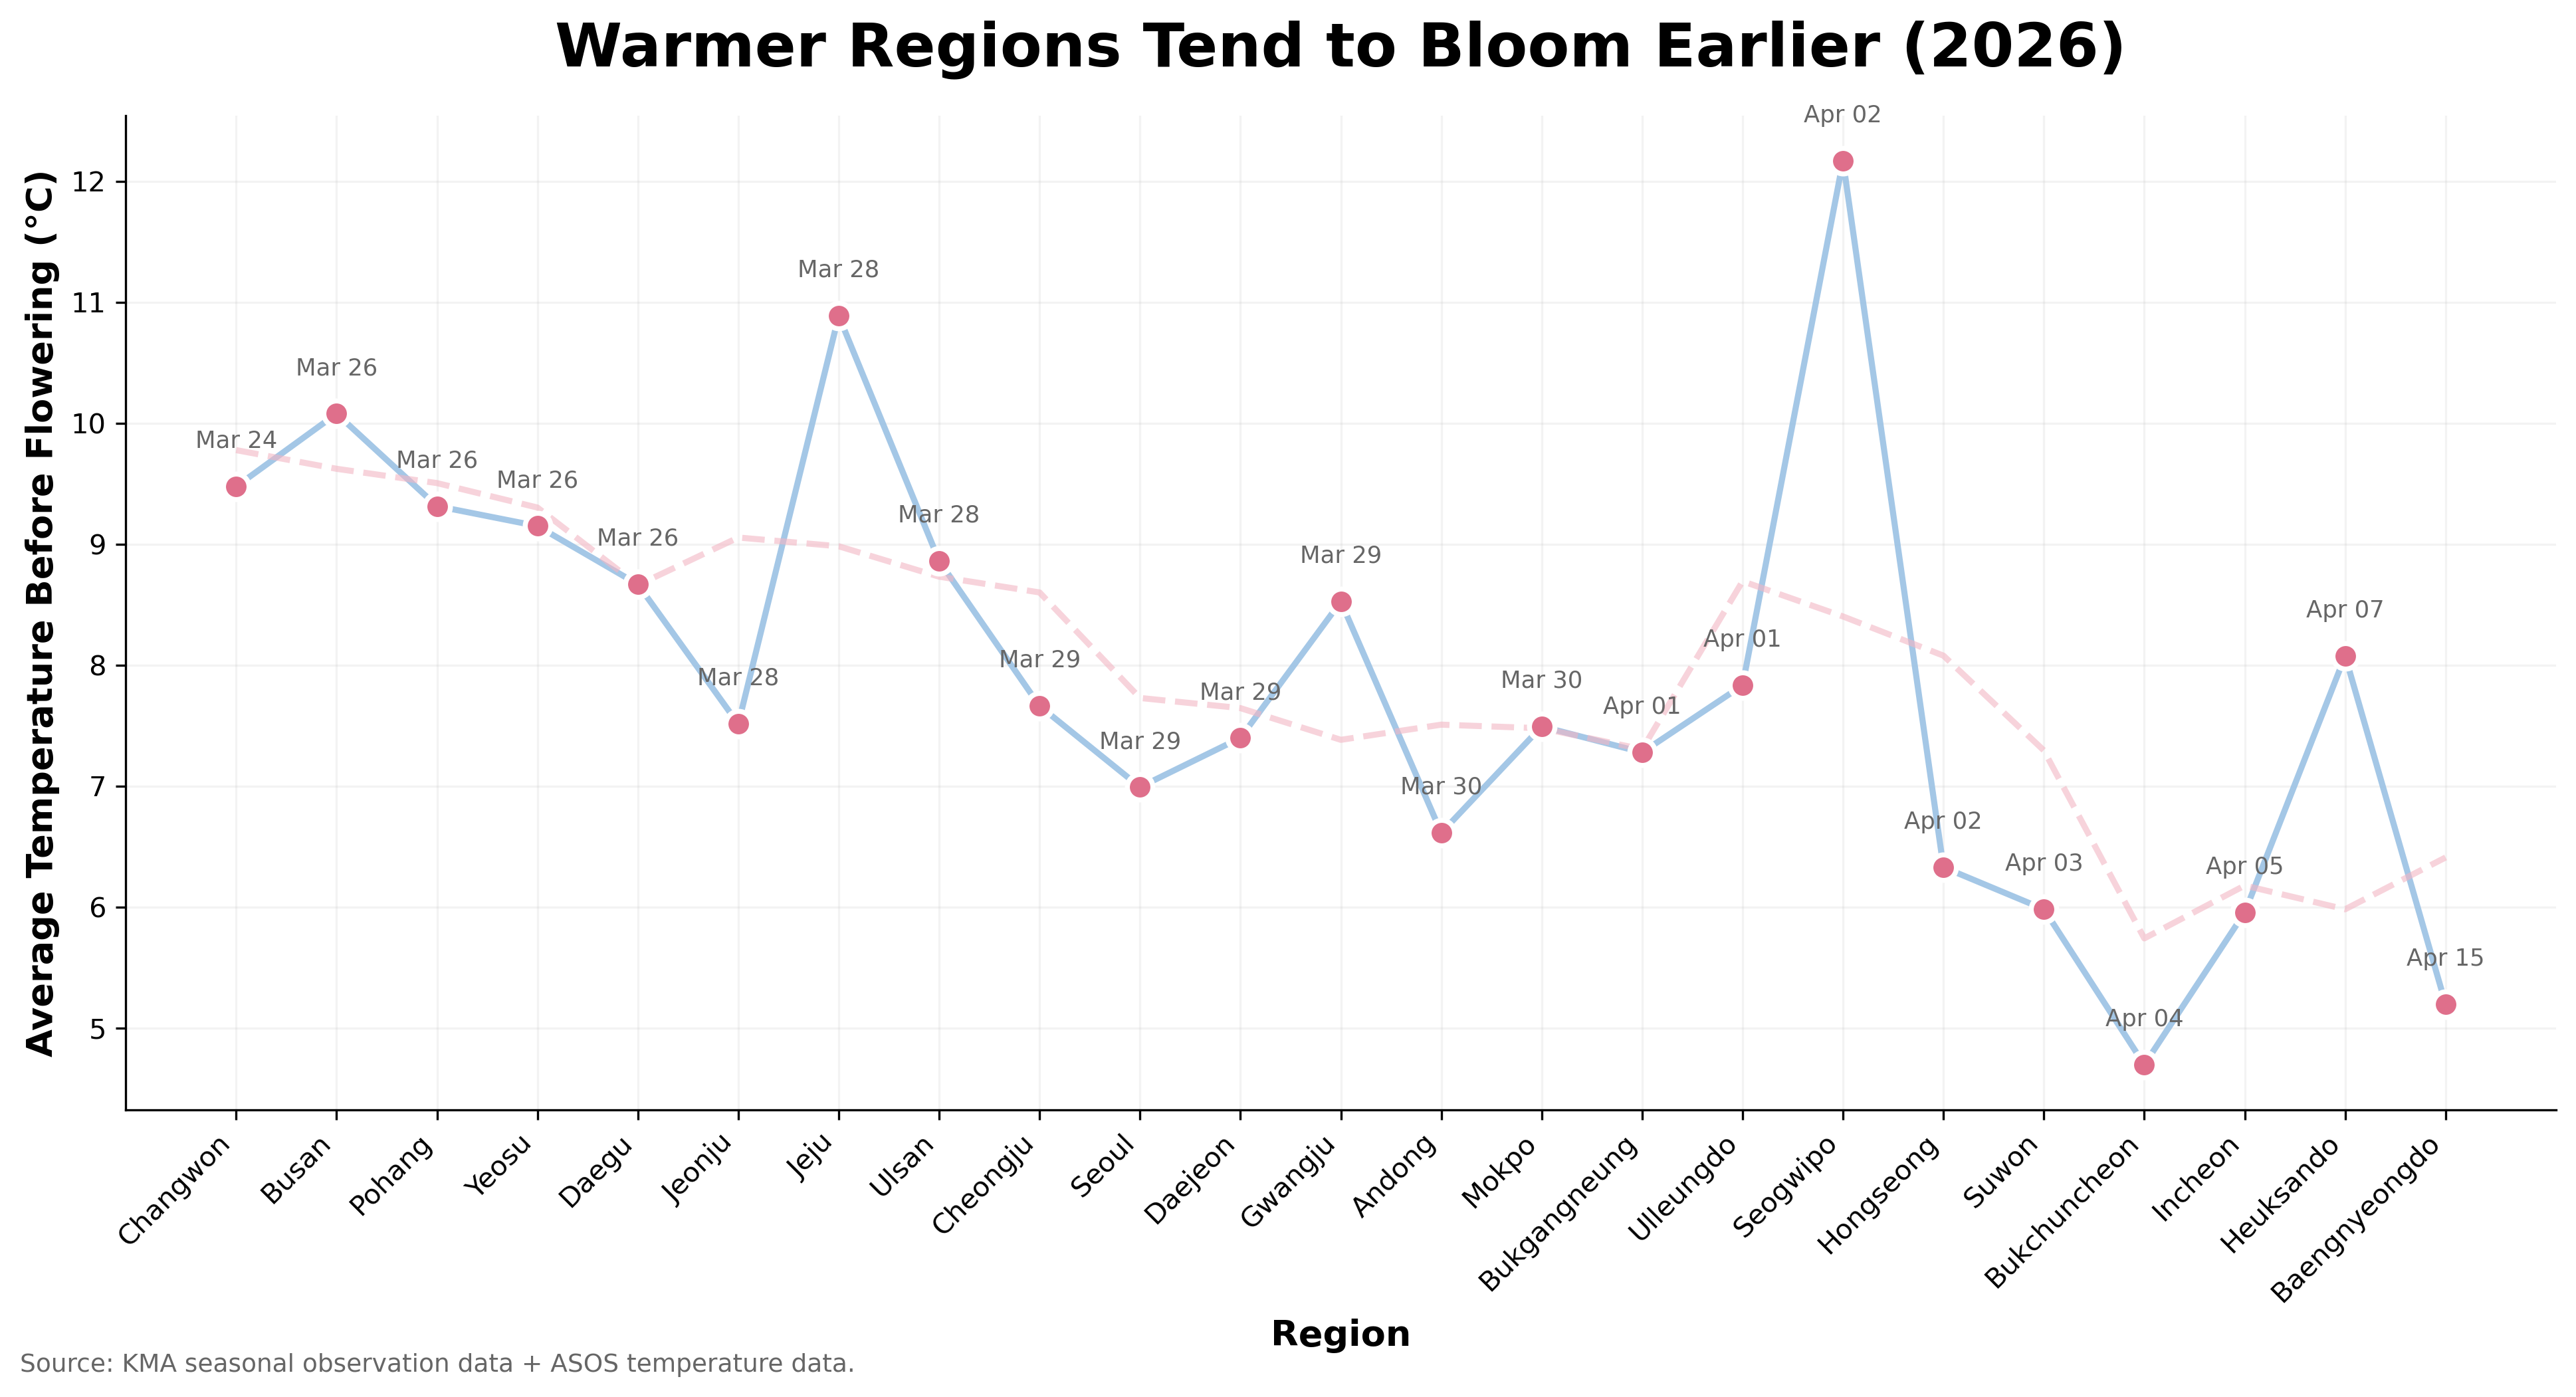
Cherry blossom flowering dates in 2026 varied clearly across South Korea. Blossoms appeared in some regions in late March, while in others, they did not emerge until mid-April. This section compares flowering dates by region, then examines whether flowering occurred earlier or later in each region compared to its historical average flowering date.
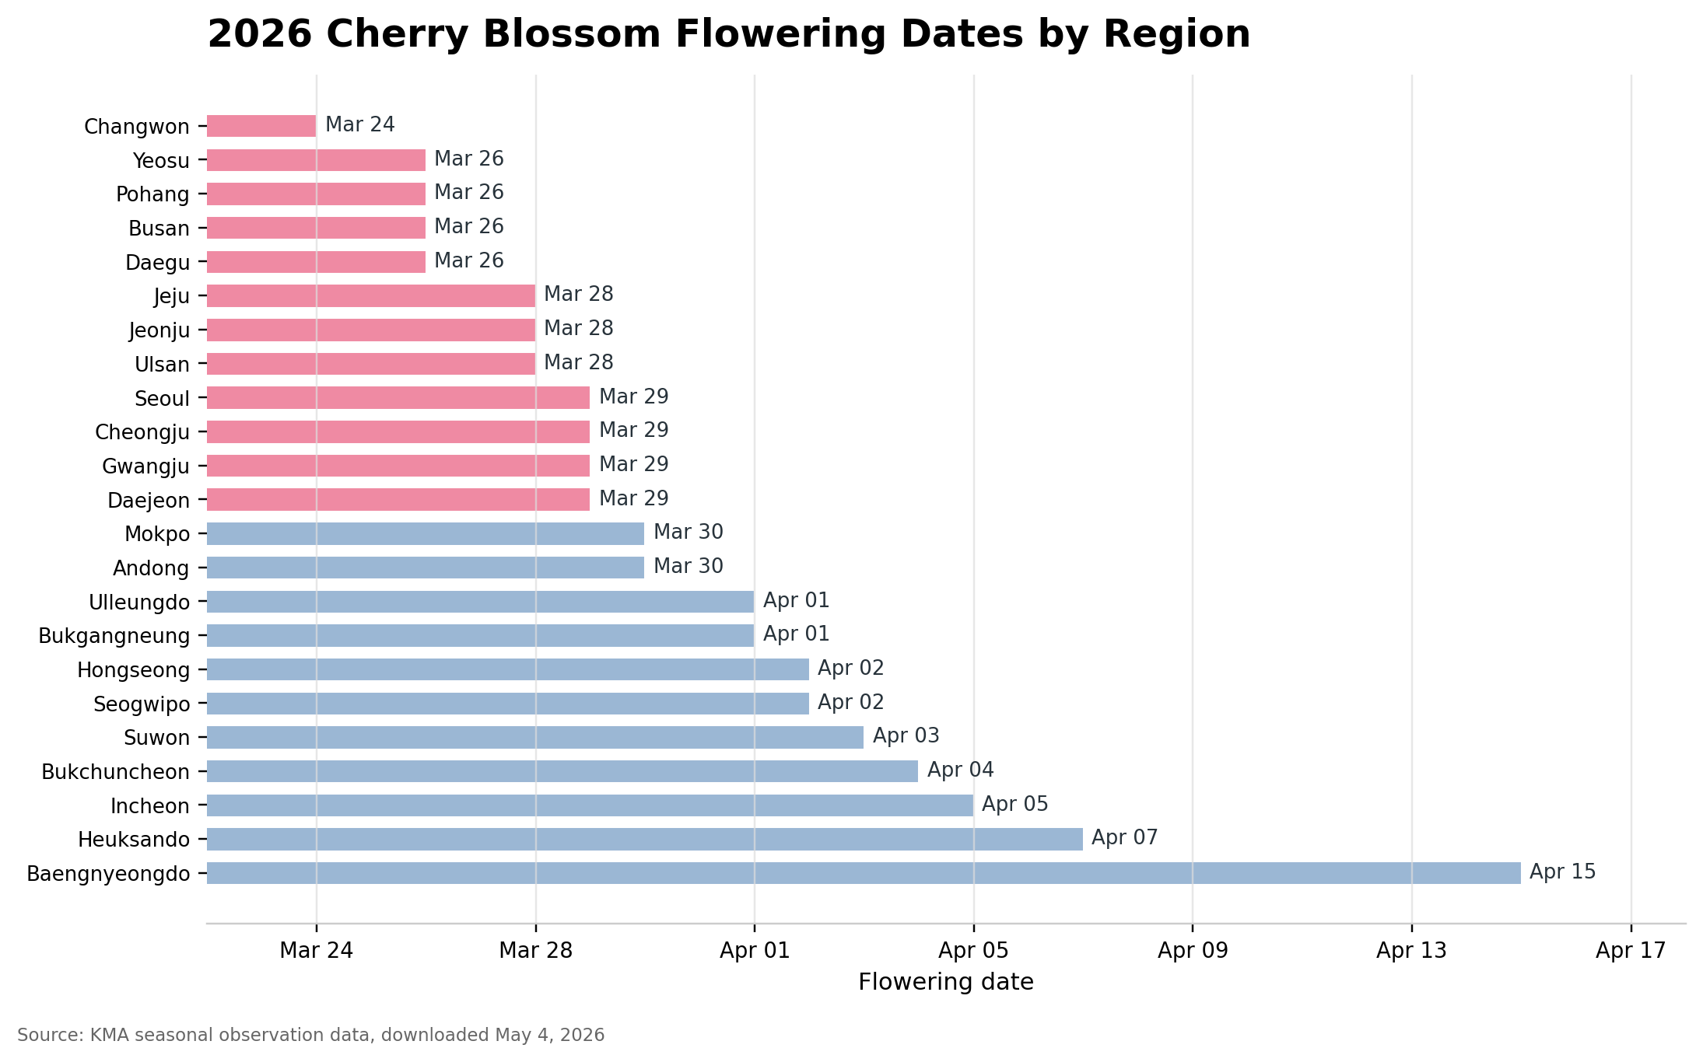
The first visualization shows clear regional differences in cherry blossom flowering dates across Korea in 2026. Flowering dates were spread across several weeks, ranging from March 24 in Changwon to April 15 in Baengnyeongdo. Flowering occurred relatively early in some regions, while others experienced noticeably later blooming periods. This pattern suggests that spring arrives at different times depending on the region.
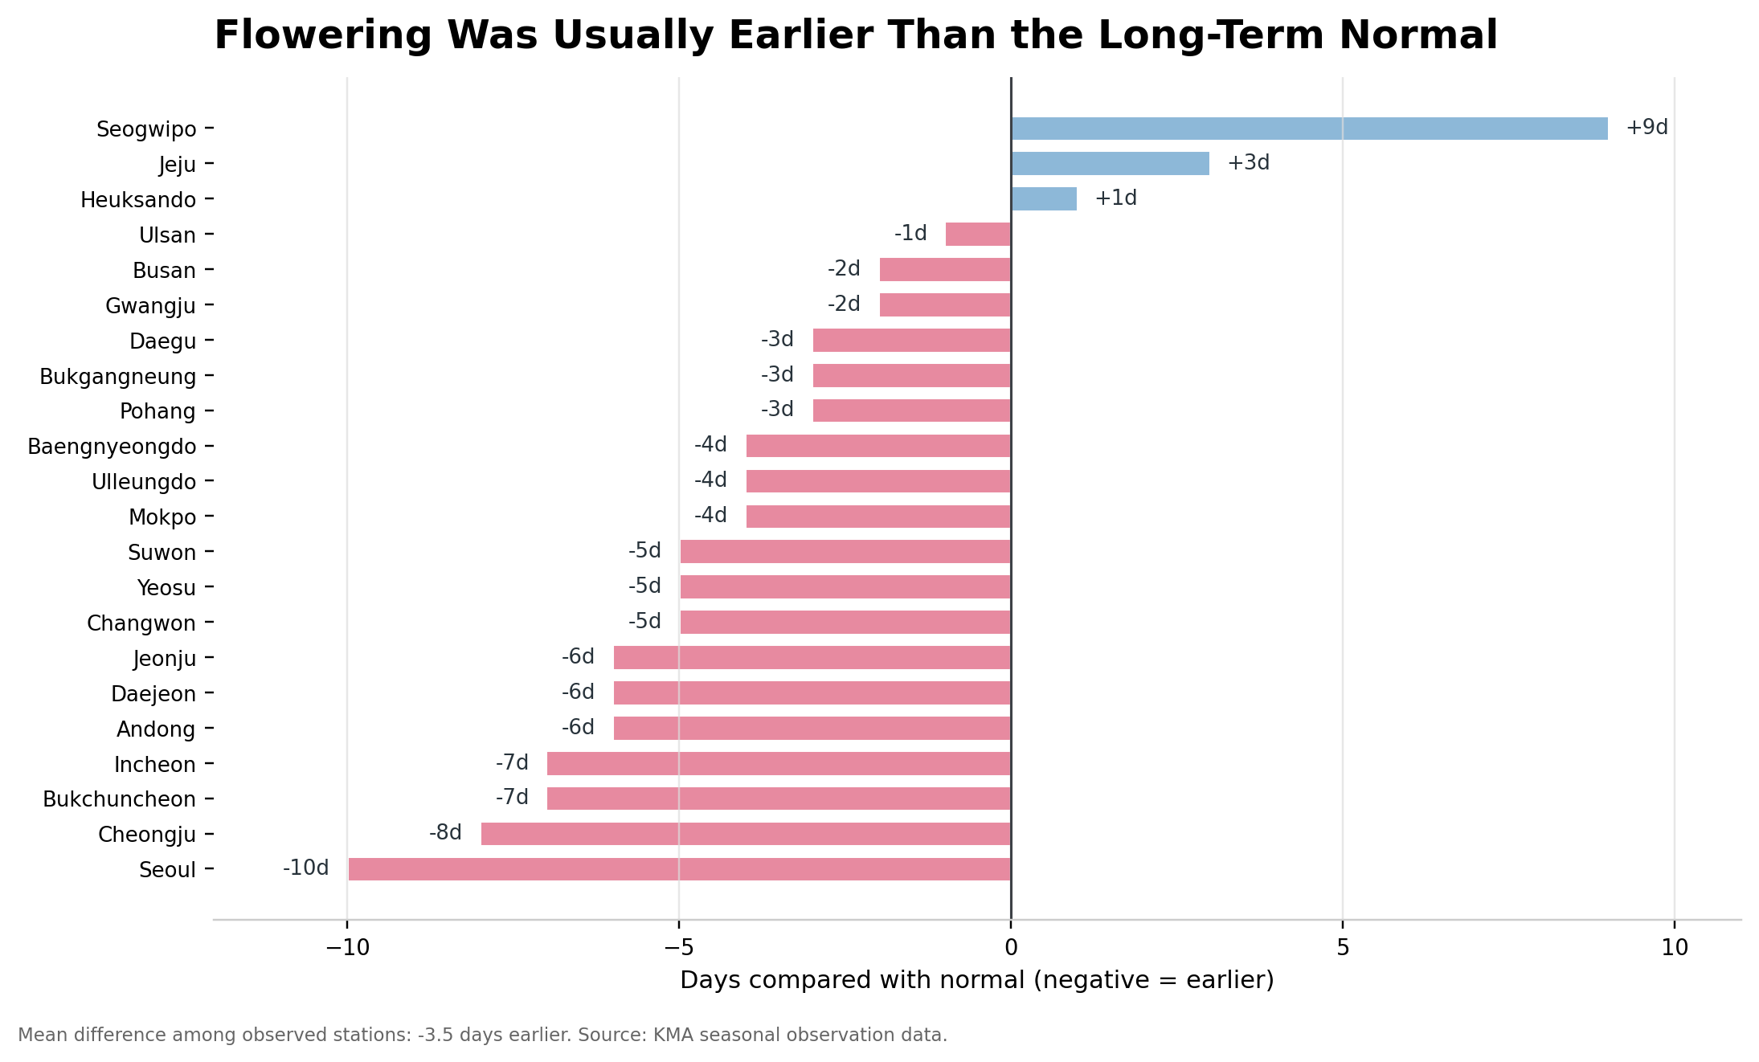
The second visualization compares 2026 flowering dates with long-term normal flowering dates. Most regions bloomed earlier than normal. Seoul showed the largest early difference, blooming 10 days earlier than normal. Cheongju was 8 days earlier, while Incheon and Bukchuncheon were 7 days earlier. However, some regions were exceptions: Seogwipo bloomed 9 days later than normal, and Jeju bloomed 3 days later. This shows that the overall pattern was earlier flowering in 2026, but the pattern was not exactly the same everywhere.